
Reducing conflict by improving water access in Uganda 🚰
Published:
I built a model that will better predict which water points are at risk of breaking down, so the Ugandan government can better monitor, improve and repair crucial water points.
1. Why is access to water so important?
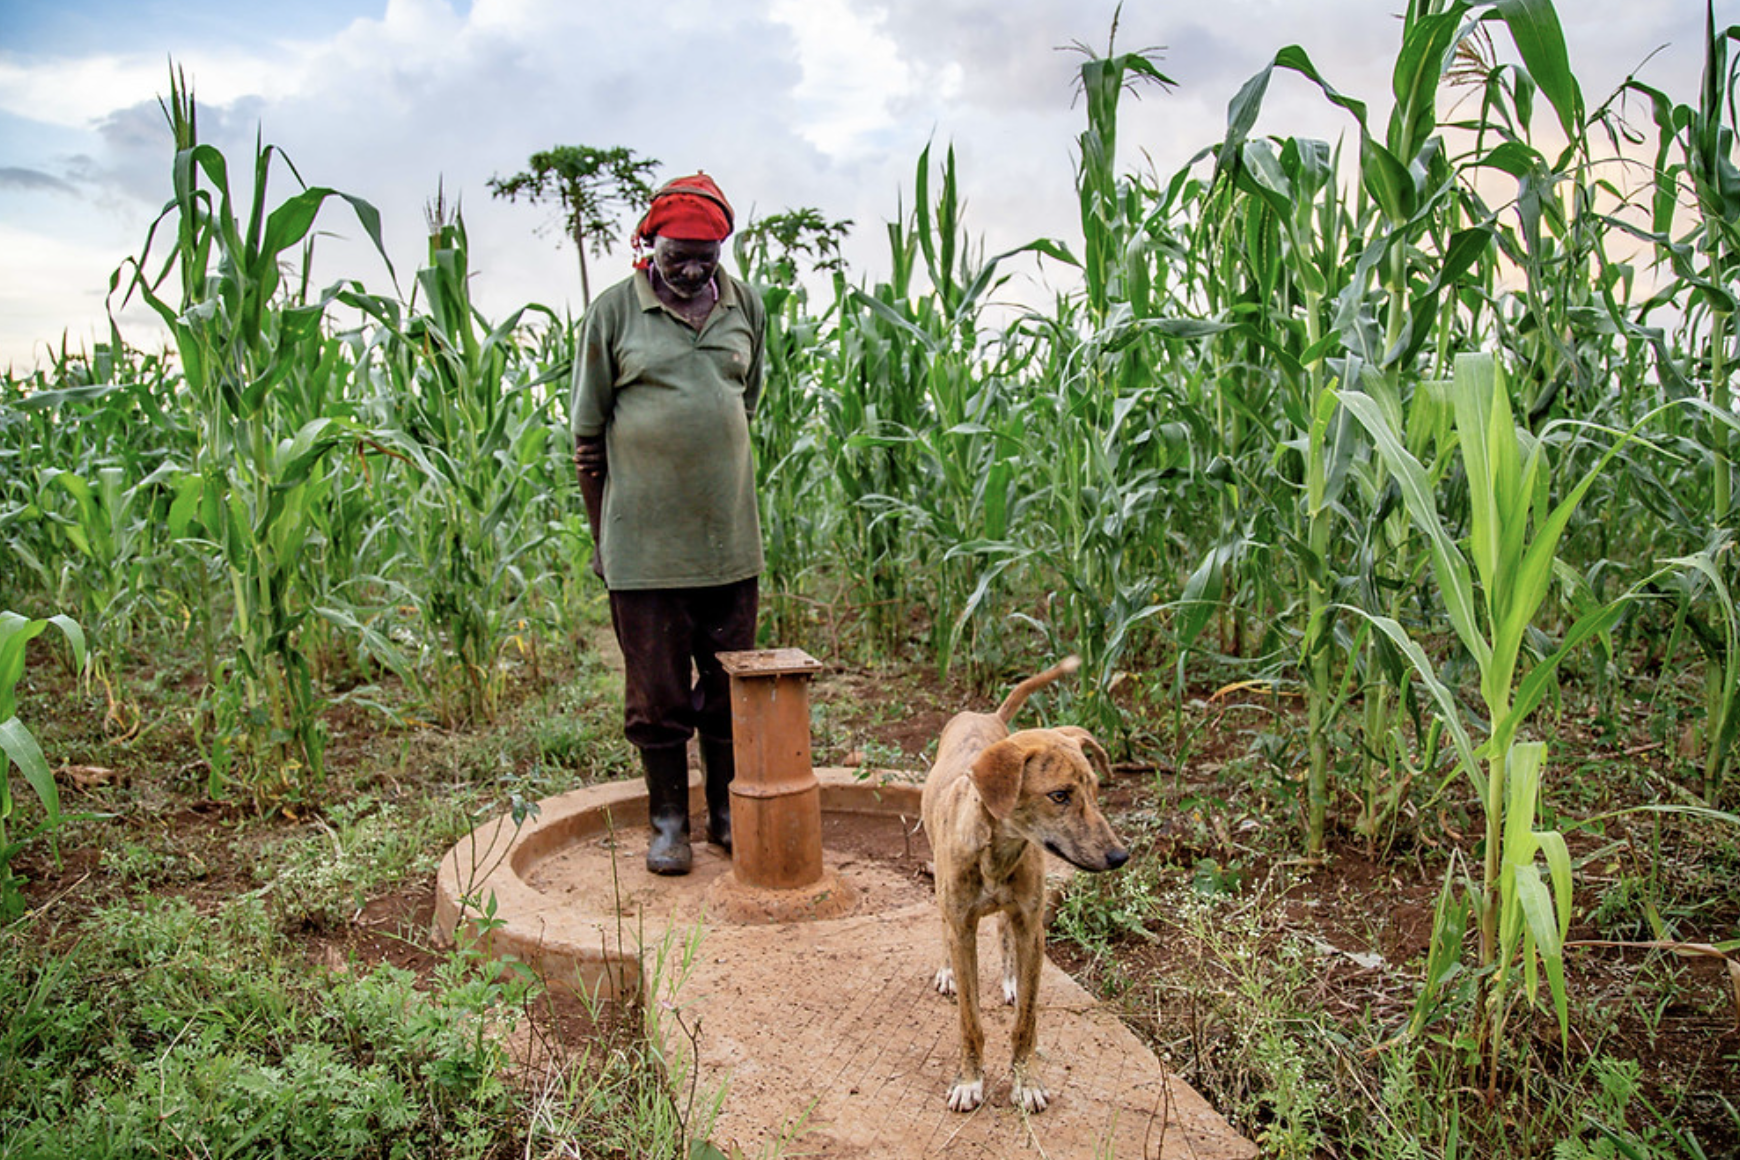
Water is one of human’s most basic needs. It helps us keep healthy, functioning and producing other basic needs such as food and shelter. As a result, access to water heavily impacts the development and prosperity of a country. Health, education, income, production, and inequality are all dependent on access to water. This is an especially important problem in Uganda, where ¾ of the population do not have access to piped water and half of healthcare facilities do not have access to running water.
This poverty and inequality also leads to political instability and violence: more than 31,000 people have been killed in conflicts in Uganda alone since 1997. Uganda has many water points across the country, and they should be enough to service every single citizen. However, too many of them break down and are not repaired.
I want to build a model that will better predict which water points have, or are at risk, of breaking down, so the Ugandan government and local public institutions can better monitor, improve and repair crucial water points. This will contribute to the development of the country and, hopefully, help reduce conflicts.
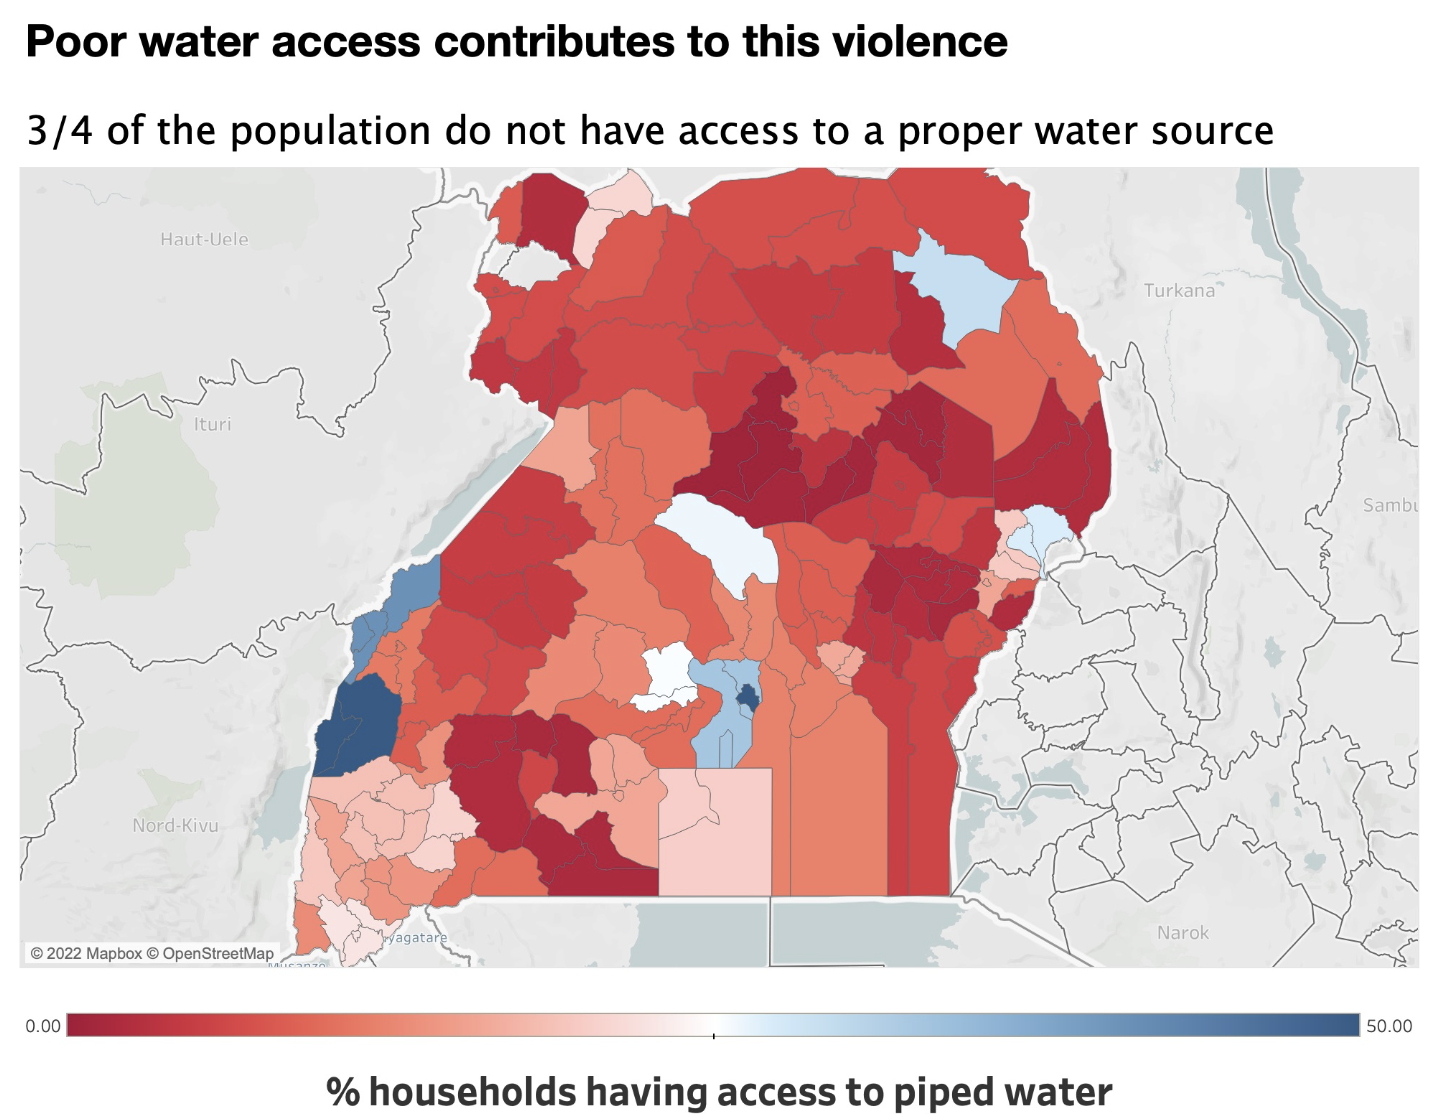
Majority of regions do not have access to piped water
2. How can I solve this problem using Machine Learning?
This is a classification problem. We need to predict whether a water point is working or not, at any given time. An NGO, the Water Point Dataset Exchange (WPDx) has attempted to build a similar model by only taking into account information on the water point itself. They have achieved a recall score of 0.4 for non-functioning points. This means that they identified 2/5 of all non-functioning water points. By introducing a wider range of economic, social and public features as well as information on local conflict, I aim to improve on this recall score. I expect my technique to work better because I will be capturing what makes a water point functioning or not. My problem statement is:
How might we use Machine Learning to predict whether a water point has broken down in order to repair it quicker and avoid future conflict?
3. Which datasets did I use?
I used three datasets. The first was data on every single water point in Uganda. Thanks to the Ugandan’s government great statistical capacity, this is up to date and contains a lot of information on the technology, status and characteristic of the point. I used the API from the Water Point Dataset Exchange (WPDx), which is an NGO that collects that information from governments.
The second was regional demographic data from the Bureau of Statistics (BoS) of Uganda. There is information for every regional level (sub-county) in the country and I had to manually download those.
Finally, I used the API of another NGO, Armed Conflict Location Event Data Project (ACLED) to get every single conflict/event that happened in Uganda, since 1997. Uganda has been involved in wars with external countries (notably the Congo) as well as having a lot of armed rebel groups in the country, creating instability and violence. Note that Uganda, itself, is not a very democratic country.
Water infrastructure and water access has been found to be intertwined with conflict. However, the main findings form research (cited below) is that demographic (socio-economic) factors are usually much more important in explaining conflict than water access directly. Therefore, we will be using both to attempt to predict water functionality.
4. How did I prepare the data?
The aim was that, for every water point, we would have information on the region in which the point was in. This included social, economic and conflict information. In addition, we had information on the characteristic of the water point and whether it was working or not. I undertook all the standard cleaning and pre-processing steps: data types, nulls, duplicates, binarizing, one-hot encoding, normalization. I also did some initial feature selection based on certain violated assumptions (multicollinearity, linearity, variance…).
5. What did the EDA tell us?
The most important information from the EDA process was the regional differences in the country. Broadly speaking the Central region (including the capital, Kampala) is the urban centre and most developed part of the country. The Northern region is the least developed and the region which has suffered the most from violence.
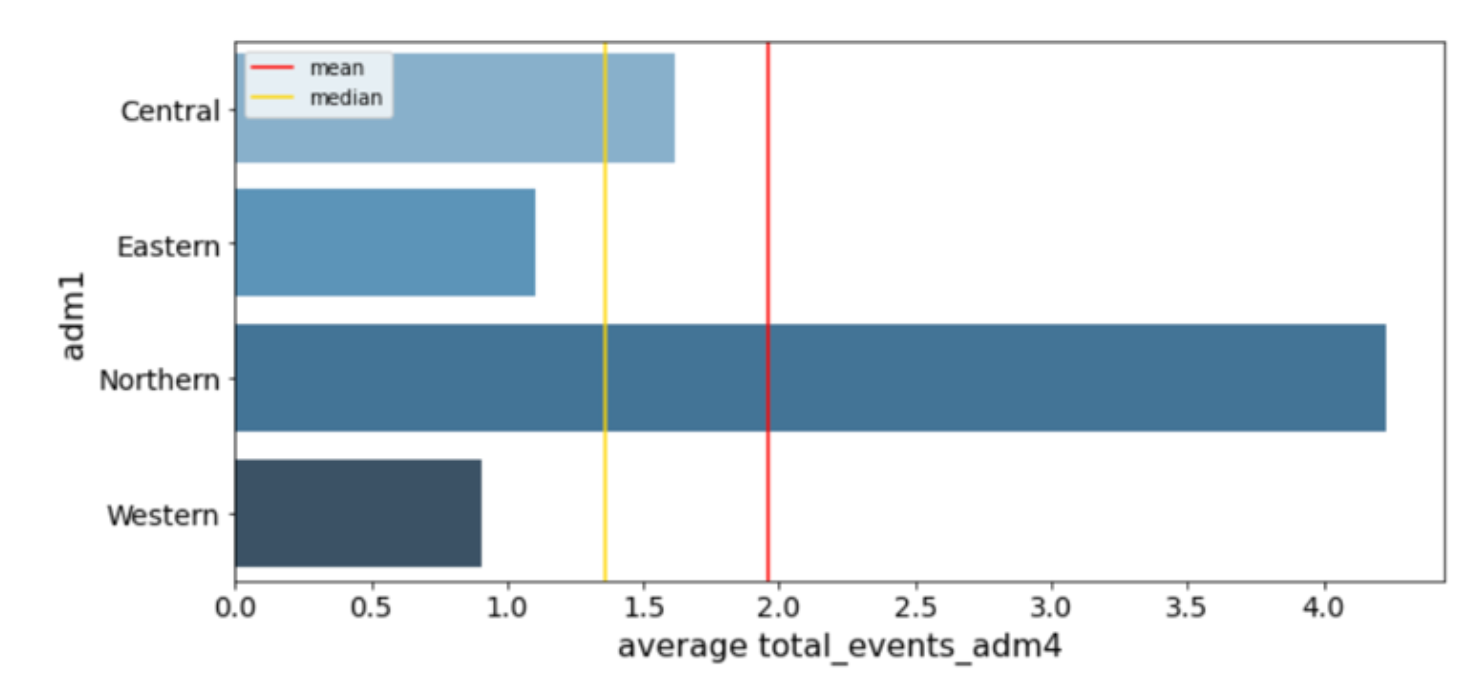
On average, sub-counties in the Northern region have each experienced 4 conflicts over the past two decades.
In addition, I identified that 2/3 of points are not of complex technology, 2/3 have been installed after 2006 and 3/4 are managed by public bodies. Overall, 1/5 of all water points are not functioning at any given time.
6. What was the modelling process?
I ran nine different ML models, the metric I was most interested in was the recall score on non-functioning points. The process was similar for each model. I first resample the data to increase the share of my minority class (non-functioning points) and scale the data when required. Then I run a baseline model, with all the default parameters. I evaluate its confusion matrix and various accuracy metrics.
Then I visualise the impact of the different hyperparameters on the accuracy score, to get a rough idea of where to focus my grid search. After that, I run a grid search or random (depending on how expensive the model is) cross validation. I also include the option of dimensionality reduction using PCA. Having found the optimal model, I rerun my model with the tuned hyperparameters and compare the confusion matrix, accuracy metrics and ROC curve with my baseline model.
I choose the best model based on their recall score for non-functioning points on the test set. With that final model, I visualise the feature importance, export the metrics and dump the model.
In the end, my best model was XGBoost as it had the highest recall score for non-functioning points, as well as good other accuracy metrics, a shorter prediction time than most models, the second-best AUC and a relatively small overfit on the training set.
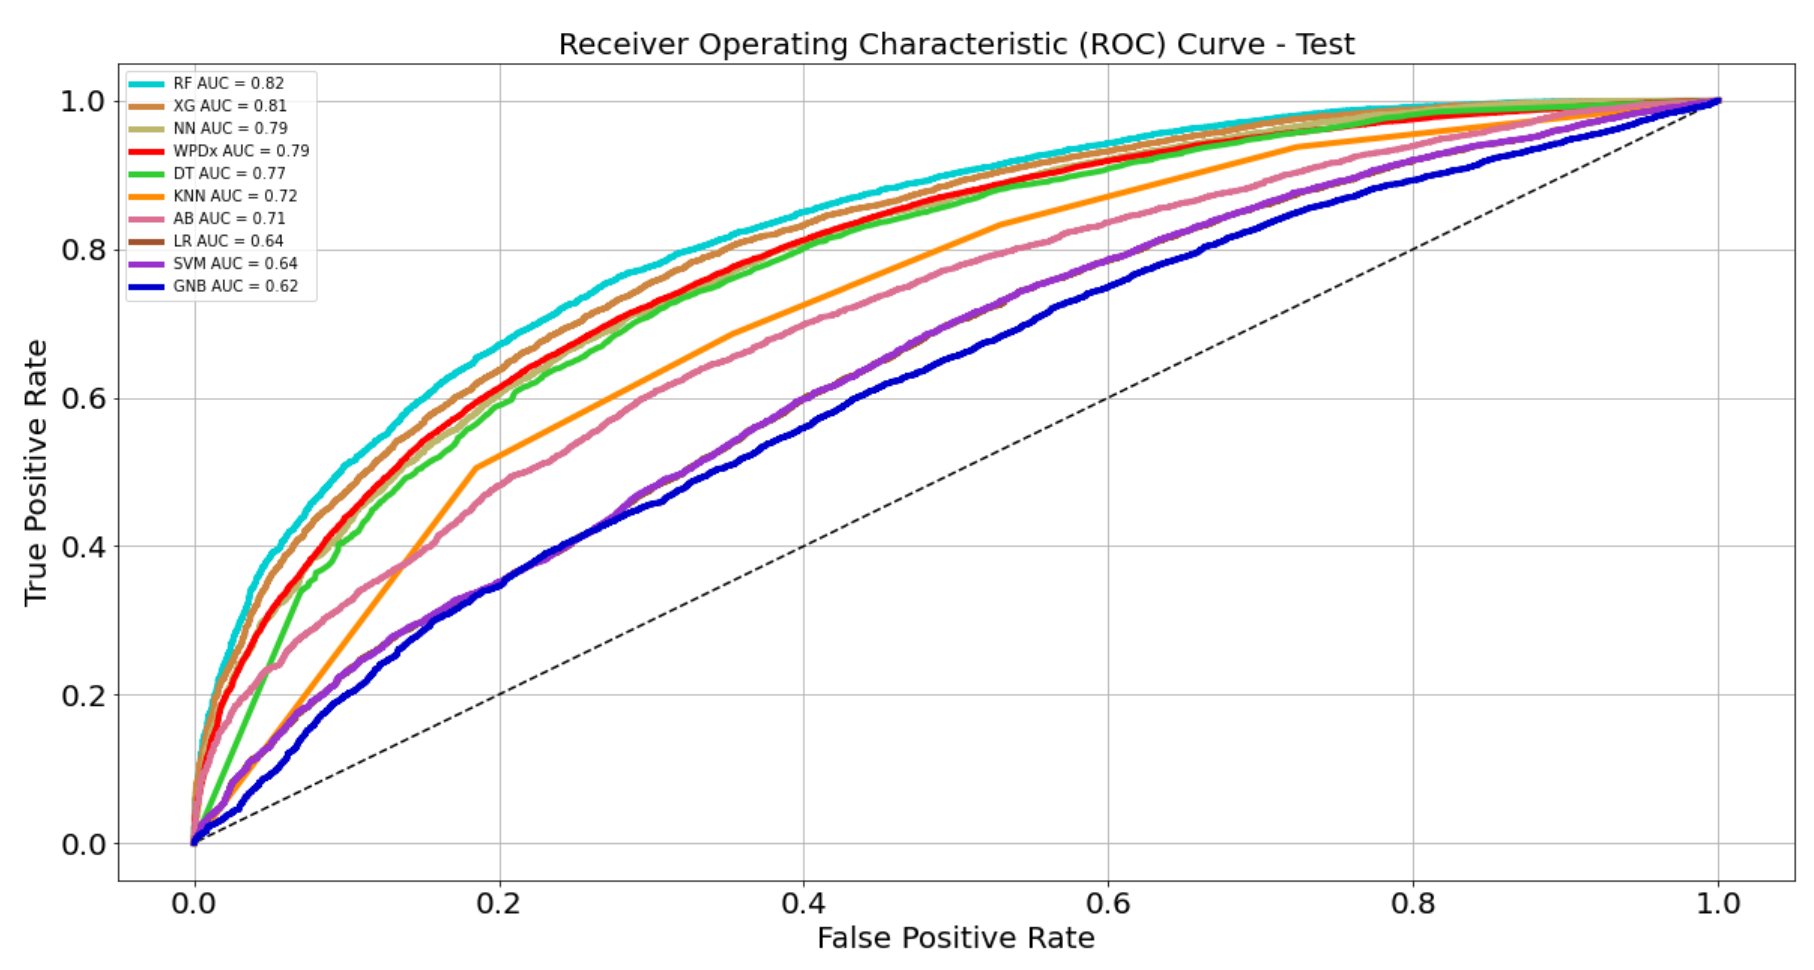
XGBoost model has the second best AUC, at 0.81.
7. What are some key findings and subsequent recommendations
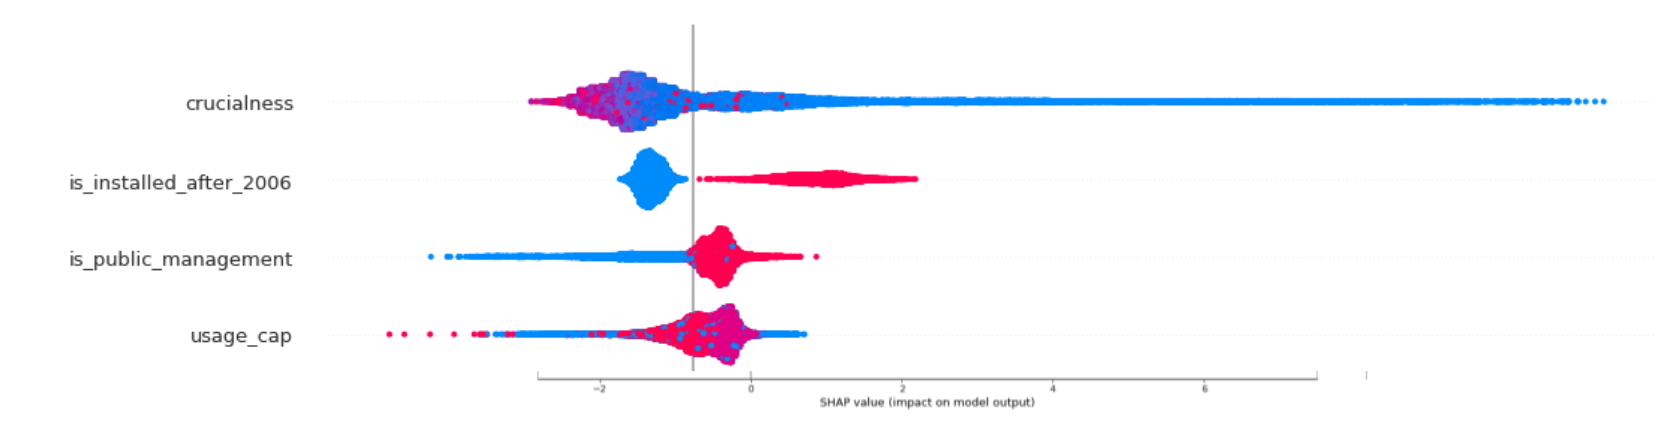
Using Shapley values for our XGBoost model as well as the feature importance of other models, I find that the best predictor for predicting a water point functioning is how crucial that water point is. Crucialness is the proportion of the local population that depends on that water point.
In addition, the usage capacity of a water point, whether it was installed after 2006 and whether it is publicly managed are all strong predictors of water point functionality. This matches some of our initial hypotheses.
One major finding is that local conflicts did not have a strong predictive effect on our outcome. This is probably because the initial reason why there is conflict is poverty and under-development, something I have attempted to capture in other variables. This confirms what the current literature has found.
From these findings, I would recommend that public bodies focus on those points which are the most important to local communities. Intuitively, this is where the most impact can be made as repair and improvement work will impact the most individuals.
However, a word of caution to keep servicing more rural and less crucial water points. These smaller communities should not be left behind and lack of water access will still heavily impact them. Not giving these communities enough attention will create inequalities and put the overall development and stability of the country at risk.

Contributing factors for one water point as an example
8. What is the impact of our model?
Our model greatly outperforms the current, WPDx, model. It identifies 50% more non-functioning points, generating $USD 28m in economic benefits and preventing 13,000 deaths each year from reliable access to clean water.
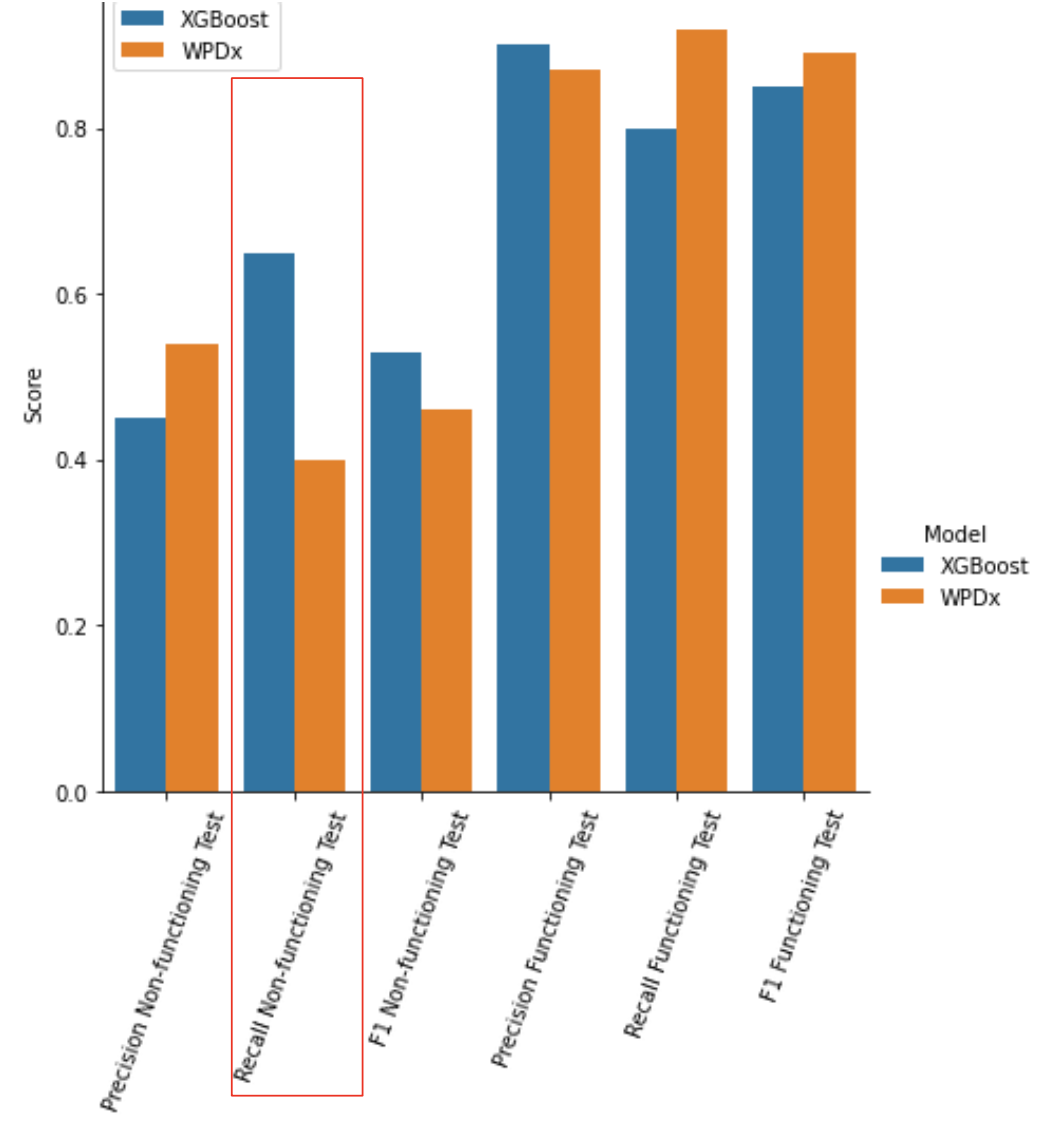
Our model identified 50% more non-functioning water points than the benchmark
9. What are potential next steps?
An obvious way to improve our model would be to include more data. This can be hard to find, but data on health outcomes, especially the mortality rate due to water-inducing sickness would be extremely helpful to understand if a water source has been damaged or contaminated (akin to the famous Jon Snow experiment in London). We could also include data for other countries, or even test our model in other water-deprived countries and test the external validity of our model.
Also, I have done a relatively extensive step of feature engineering before running the model, to introduce a more qualitative analysis. It might make sense to run our models with all the available features, and introducing more aggressive regularization, to see if the models choose to drop the same variables as I did and if it gets better accuracy metrics. In addition, it would be worth spending more time on neural networks and test a wider range of complex architectures to look for improvements.
Finally, it should be said that my classification problem and the features included might not lend itself to more complex models. It might be that the relationship between my features and my outcome is relatively straightforward and does not need more complicated steps. Anyhow, the model that best enables the citizens of Uganda to meet their basic needs should be prioritised.
— — — — — — — — — — — — — — — — — — — — — — — — — — — — — —
Relevant papers:
- Detges A. Local conditions of drought-related violence in sub-Saharan Africa: The role of road and water infrastructures. Journal of Peace Research. 2016;53(5):696–710. doi:10.1177/0022343316651922
- Detges, A. (2017). Droughts, state-citizen relations and support for political violence in Sub-Saharan Africa: A micro-level analysis. Political Geography, 61, 88–98. https://doi.org/https://doi.org/10.1016/j.polgeo.2017.07.005
- Ide T, Lopez MR, Fröhlich C, Scheffran J. Pathways to water conflict during drought in the MENA region. Journal of Peace Research. 2021;58(3):568–582. doi:10.1177/0022343320910777
- Theisen, Ole Magnus, Helge Holtermann, and Halvard Buhaug. 2011/12. Climate wars? Assessing the claim that drought breeds conflict. International Security 36(3): 79–106. https://www.hbuhaug.com/wp-content/uploads/2014/02/IS-2011-for-web.pdf
— — — — — — — — — — — — — — — — — — — — — — — — — — — — — —
This is my final capstone project as part of Brainstation’s Data Science bootcamp (August 2022-London).
I am especially thankful to the Water Point Data Exchange, the Armed Conflict Location & Event Data Project and the Ugandan Bureau of Statistics for providing the data for my project. The thorough documentation, ease of use and accessibility of the data made my project possible and enjoyable. If these datasets and this project has been of use to you, consider donating to the WPDx.